•This window displays a communication with the TR module:
oData sent from the Terminal window (Terminal, SPI Test, DPA Test or ICSS Test modes) or IQMESH Network Manager background communication as Tx data.
oData sent by user application in TR module as Rx data.
•Logged data is displayed and stored at the same time in a buffer with capacity for 200.000 records (rows).
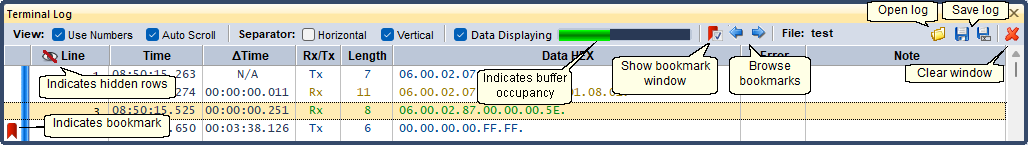
oCurrent buffer occupancy is indicated graphically (see the picture below) and textually after positioning the mouse cursor over this indicator (Tools / Options / Evironment Options / Show Hints checkbox must be checked).
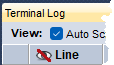
oData displaying can be suspended and then re-enabled through Data Displaying checkbox.
oIf the buffer is full, data logging and displaying is stopped and the Check Mode is disabled..
oThe buffer can be emptied by clearing the window.
![]()
oUse Numbers (Terminal mode only)
Data is displayed according to the Use Numbers feature.
The window is scrolled automatically to make the last row visible all the time.
oHorizontal
An empty line is included between individual rows.
oVertical
Displays vertical lines between columns.
Activates / disactivates data displaying in the window. When activated, possible data stored in the buffer is displayed..
▪![]() Data is displayed and stored in the buffer.
Data is displayed and stored in the buffer.
▪![]() Data displaying is not active, the buffer contains no not-displayed data.
Data displaying is not active, the buffer contains no not-displayed data.
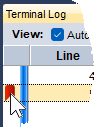
▪![]() Data displaying is not active, the buffer contains not-displayed data.
Data displaying is not active, the buffer contains not-displayed data.
•By clicking the right mouse button on the header row of the table a menu enabling to select visible columns of the table is shown.
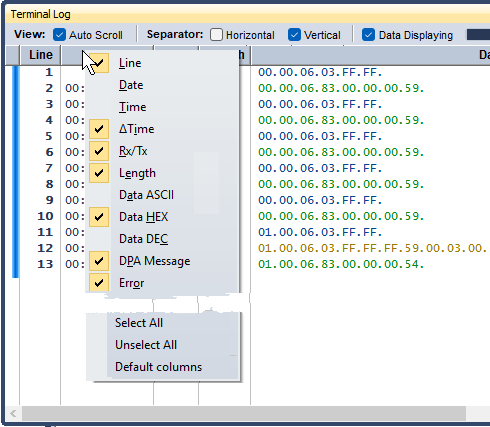
oDefault Columns
Displays default columns according to current Terminal Mode and sets the default width for them.
oCopy Column Names
Copies column names to the Windows clipboard.
•Doubleclick on right column edge to set its width according to the longest text.
![]()
•Click and drag the column header to change the column order as you wish.
•Click the leftmost column header to select all rows.
•Hover the mouse over a column header (only some) to show a useful hint.
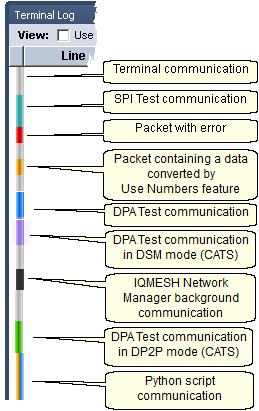
•The first column is always displayed indicating some packet properties by colors.
•Click the icon in the Line column header to show/hide hidden rows.
•Click the leftmost column to toggle (place/delete) a bookmark at a given row.
•The Previous / Next Bookmark buttons only scrolls through bookmarks on unhidden rows.
•Select a row with a bookmark and press Space to open the Edit Bookmark window allowing to set the bookmark name (multi-line text) and color.
•Hover the mouse over the bookmark to show the bookmark name.
•Column Error displays possible communication errors.
oCRCx (Terminal only)
Error in the CRCx check byte (see document SPI Implementation in IQRF TR modules).
oSPI (SPI Test only)
Number of data received does not correspond to number of data sent.
oDPA (DPA Test only)
Error messages according to IQRF DPA specification.
•To display menu, click the right mouse button in the window area.
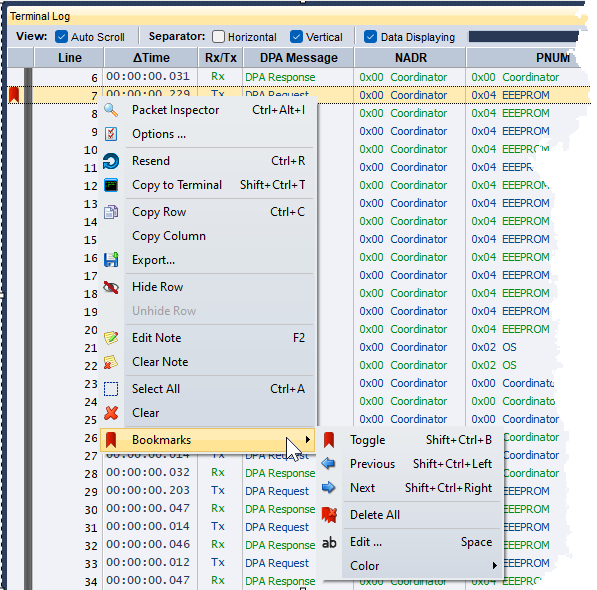
oPacket Inspector Ctrl+Alt+I
Opens selected (highlighted) packet in Packet Inspector window.
oOptions ...
Opens the Terminal Log settings.
oResend Ctrl+R
Resends selected packet. Allowed only for Tx packets sent from Terminal Mode which is actually selected.
oCopy to Terminal Shift+Ctrl+T
Copies selected packet to the Terminal / Data to send field. Allowed only for Tx packets.
oCopy to Terminal as ASCII
Copies selected packet to the Terminal / Data to send field as a ASCII string. Allowed only for the Terminal Mode: Terminal.
oCopy to Terminal as HEX
Copies selected packet to the Terminal / Data to send field as hexadecimal numbers according to the Use Numbers feature. Allowed only for the Terminal Mode: Terminal.
oCopy to Terminal as DEC
Copies selected packet to the Terminal / Data to send field as decimal numbers according to the Use Numbers feature. Allowed only for the Terminal Mode: Terminal.
oCopy Row Ctrl+C
Copies selected rows to the Windows clipboard.
oCopy Column
Copies column (on which the menu was opened) of selected rows to the Windows clipboard.
oExport
Exports content of the window to the TXT, HTML, CSV or XML file.
oHide Row
Hides selected rows.
oUnhide Row
Shows hidden rows in selected rows. To show all hidden rows, first click the Select All menu item or click the leftmost column header.
oEdit Note F2
Allows to edit a Note on the selected row.
oClear Note
Clears notes on selected rows.
oSelect All Ctrl+A
Selects (highlights) all rows.
oClear
Deletes all rows.
▪Toggle Shift+Ctrl+B
Toggles (places/deletes) a bookmark at given row.
▪Previous Shift+Ctrl+Left
Goes to the previous bookmark.
▪Next Shift+Ctrl+Right
Goes to the next bookmark.
▪Delete All
Deletes all bookmarks.
▪Edit ... Space
Opens the Edit Bookmark window allowing to set the bookmark name (multi-line text) and color.
▪Color
Allows to change the bookmark color.
•Rows can be selected (highlighted) also by a mouse.
•Double-click a row or press Enter to open a given packet in the Packet Inspector window.
•Rows differ in color according to the Terminal Mode of the Terminal window.
▪Blue - Tx data sent to the TR module.
▪Green - Rx data received from the TR module.
▪Orange - Data converted by the Use Numbers feature.
oDPA Test mode:
▪Light blue - DPA Notification ▪Purple - DPA Asynchronous ▪Dark blue - DPA or DP2P Request ▪Orange - DPA Confirmation or DP2P Invite ▪Green - DPA or DP2P Response |
|
•Rows of IQMESH Network Manager background communication are tinged with gray.
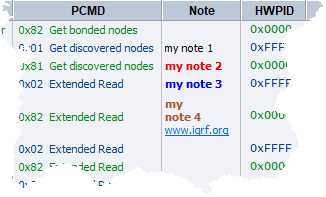
•Select a row and press F2 or double-click a row to edit the Note column.
oIt is possible to enter multi-line plain text or use HTML coding with limited functionality.
▪Press Shift+Enter to create a new line.
▪Press Enter to exit editing and keep the content.
▪Press Esc to exit editing and erase the content.
▪The text is limited to 1000 characters.
oSupported subset of HTML tags.