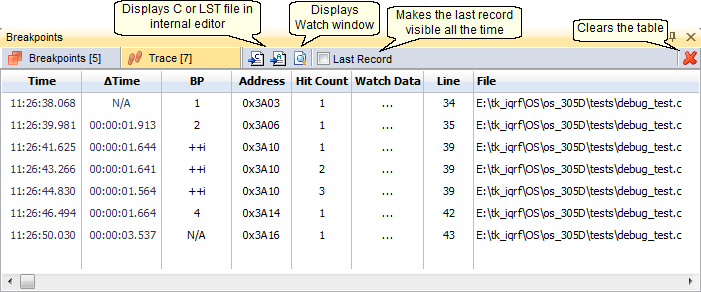
This window displays a trace list of executed breakpoints.
Note:
Interconnection of the Trace table and a source file works only in the internal editor. If the external editor is selected then the internal editor works in "read only" mode.
•Table columns
oTime
Time of breakpoint execution.
o![]() Time
Time
Time from last break.
oBP
Breakpoint name. Relates to the name expression in the debugW(name)macro. If the debug() function is used instead of this macro, the breakpoint name is not available (N/A).
oAddress
MCU memory address of a breakpoint.
oHit Count
Shows number of execution of given breakpoint.
oWatch Data
Indicates if given record has some values available for the Watch window or Debug tables. Doubleclick the row in this column to open the Watch window with relevant values for given breakpoint.
oLine
Source file line number with a breakpoint.
oFile
Source file containing the breakpoint.
•Doubleclick the table row to show given breakpoint in source file opened in internal editor.
•There is an interconnection between the table and a source file (C and LST). A breakpoint selected (highlighted) in the table is automatically found and highlighted in a source file. The arrow up and down keys can be used to scroll table.
•By clicking the right mouse button on a table row the following menu is shown:
oView in Source File
Opens a C file in internal editor with highlighted breakpoint.
oView in List File
Opens a LST file in internal editor with highlighted breakpoint.
oView in Watch
Opens the Watch window with relevant values for given breakpoint.
oClear Ctrl+D
Clears the table.