IQRF operating systems provides the debug() function (or macro breakpoint(number) can be used) to be placed wherever internal variables, internal EEPROM, registers or RAM content should be evaluated and displayed. An application uploaded into TR module (Upload) runs until the debug() function is encountered. Then the program is stopped and the TR module is switched to debug mode (it is indicated at the bottom status bar). IQRF IDE reads the data automatically and activates the Skip Breakpoint button.
To display the data, IQRF IDE uses the following tables:
•Internal EEPROM
oUser Data
oApplication Info
•User RAM
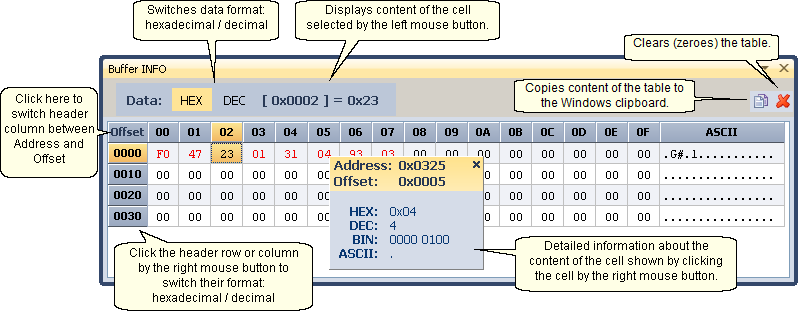
•Buffer INFO
•Buffef COM
•Buffer RF
•Buffer AUX
Managing tables
•Table windows can be shown by View / Debug menu.
•Cells with changed content (compared to previous debug displaying) are highlighted in red.
•See the picture below for other table features.