The table representation of scanned channels.
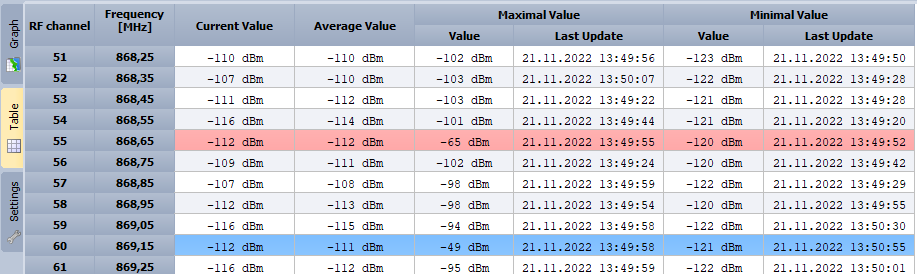
•The red color indicates channels crossing the RSSI Notification threshold (red line in the graph).
•The blue color indicates channels with absolute maximal RSSI value (blue line in the graph).
•Use the Export button on control panel to export the table to CSV, HTML, PDF, RTF, TXT, XLS, XLSX or XML file
•Doubleclick a table row (channel) to display it in the graph.
•Hot keys for working with map:
oHome ... jump to the first column (left)
oEnd ... jump to the last column (right)
oCtrl+Home ... jump to the first row (up)
oCtrl+End ... jump to the last row (down)
oArrows ... shift to next column or row
oPage Up, Page Down ... vertical table shifting