The graphical representation of scanned channels.
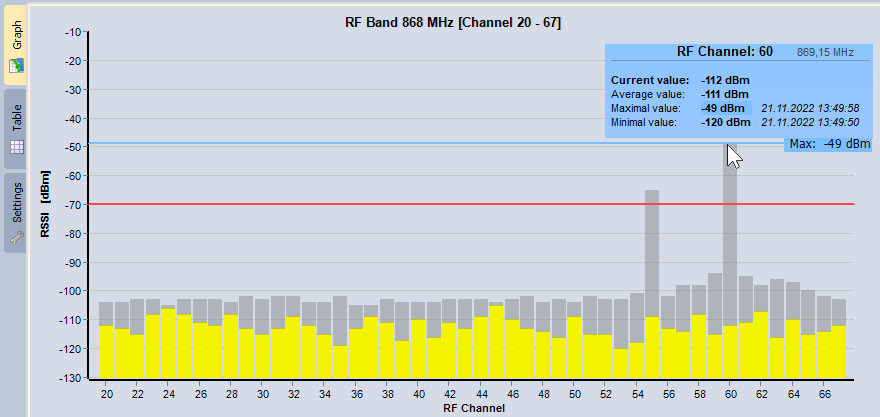
•Put the mouse cursor on a channel to display table with detailed information. See the picture above.
•Click and drag the red line to change the RSSI Notification threshold.
•Use the Export button on control panel to export the graph to BMP, PNG, TIF, JPG, GIF or EMF file.
•The graph can be horizontally zoomed in / zoomed out by the mouse wheel.
•Click the mouse wheel to fit graph.
•Hot keys for working with graph:
oCtrl+plus ... zoom in
oCtrl+minus ... zoom out
oCtrl+0 ... fit graph
oArrows ... fine horizontal graph shifting
oShift+arrows ... coarser horizontal graph shifting
oPage Up, Page Down ... coarse horizontal graph shifting
oHome ... jump to the left of the graph
oEnd ... jump to the right of the graph